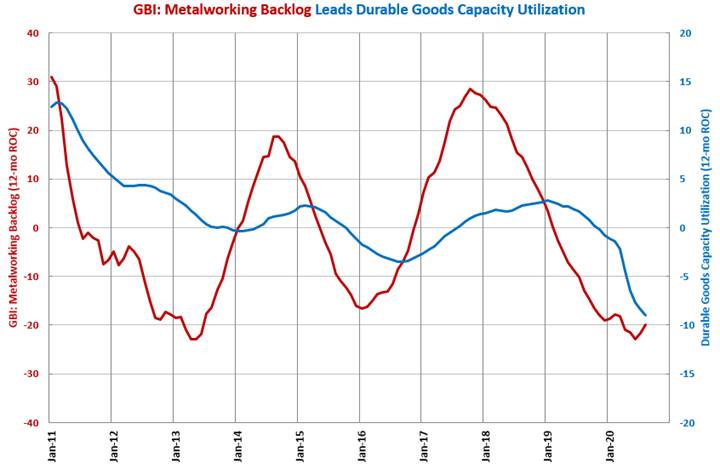
Capacity Utilization Improving
Compared with one year ago, capacity utilization contracted 8.5%, which was the fourth straight month that the month-over-month rate of change contracted at a slower rate and the slowest rate of contraction since February.
In August, durable goods capacity utilization was 69.4%, which was the fourth month in a row the rate of capacity utilization moved higher. Compared with one year ago, capacity utilization contracted 8.5%, which was the fourth straight month that the month-over-month rate of change contracted at a slower rate and the slowest rate of contraction since February.
The annual change in durable goods capacity utilization contracted at an accelerating rate for the 10th month in a row, falling to -9.0% from -8.4%. August was the fastest rate of annual contraction since March 2010. As the annual rate of change tends to lead capital equipment consumption by seven-to-10 months, capacity utilization is signaling accelerating contraction in capital equipment spending through at least the third quarter of 2020.
The GBI: Metalworking backlog index tends to lead the annual rate of change in capacity utilization by seven to 10 months. In August, the backlog index contracted just 3.2% compared with one year ago. However, the annual rate of contraction in the backlog index appeared to reach a bottom in June. The Backlog index is indicating that the accelerating contraction in durable goods capacity utilization will end sometime during the 3rd or 4th quarter of 2020.

Accelerating Growth:
Decelerating Growth:
Accelerating Contraction: aerospace, automotive, construction materials, custom processors, durable goods, forming/fabricating (non-auto), furniture, machinery/equipment, petrochemical processors, plastics/rubber products, primary metals, printing, textiles/clothing/leather goods, wood/paper products
Decelerating Contraction: electronics/computers, food/beverage processing


.JPG;width=70;height=70;mode=crop)
