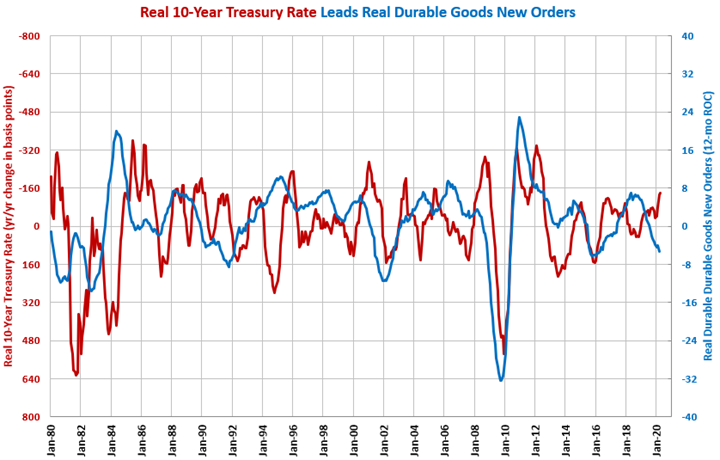
Change in 10-Year Rate Lowest Since July 2012
In April, the year-over-year change in the real rate was -140 basis points. The change was negative for the 16th month in a row. This was the lowest level for the year-over-change since July 2012.
In April, the nominal 10-year Treasury rate was 0.66%, which was the second month in a row and the second month ever that the monthly average was below 1%. Also, this month’s rate was the all-time low for the 10-year Treasury rate.
The real 10-year Treasury rate, which is the nominal rate minus the rate of inflation, was -1.13%. This was the fourth consecutive month the real rate was negative. And, it was the lowest negative real rate since July 2012. The real rate would have been even lower except the inflation rate has fallen significantly (the real rate is the nominal rate minus the inflation rate). In April, the annual rate of inflation was just 0.33%, which was the lowest rate since October 2015.
In April, the year-over-year change in the real rate was -140 basis points. The change was negative for the 16th month in a row. This was the lowest level for the year-over-change since July 2012.

A falling change in the real 10-year Treasury rate tends to be a positive signal for durable goods manufacturing. Declining changes in the real 10-year Treasury rate tend to lead growth in durable goods new orders and capital equipment consumption by a relatively long period of time – historically, between 12 and 24 months. The declining change in the 10-year Treasury rate is a good leading indicator of growth in housing permits, construction spending and consumer durable-goods spending as well.
However, businesses and consumers are tightening their spending due to the COVID-19 pandemic, which means the typical correlation of a lower 10-year Treasury and growth in the above metrics may not occur.


.JPG;width=70;height=70;mode=crop)
