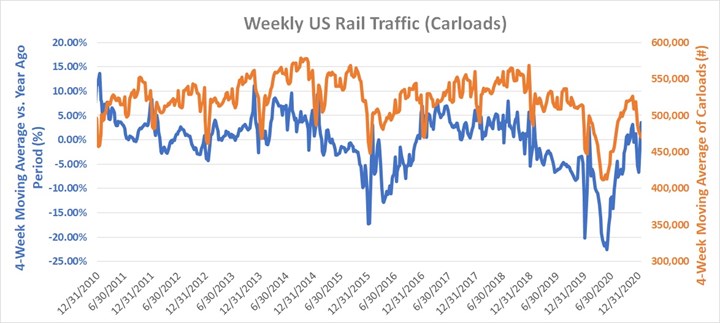
Growing Railcar Units Activity Consistent with Growing Durable Goods Orders
Durable goods new orders during the fourth quarter of 2020 were showing strong year-over-year gains. One high-frequency measure that can serve as a proxy for more recent durable goods orders is railcar activity measured weekly.
Durable Goods: New Orders during the fourth quarter of 2020 were showing strong year-over-year gains. In the latest available release, monthly new orders very nearly matched pre-pandemic levels ($244.4B vs. $246.2B in 2/2020). Unfortunately, the latest reading for Durable Goods: New Orders is from November; however, there are high-frequency measures that can serve as a proxy for monitoring durable goods orders and activity in near real-time. One of these is railcar activity measured weekly.
For the week period ending 1/16/2021, total carload units was up 5.4% from the same week 1-year ago. Charted here is the 4-week moving average of the same metric, along with a 4-week moving average of carload units. The 4-week average change indicates a slightly lower 3.6% increase in carload units activity using Gardner’s own calculation.

US carload activity has increased during the early weeks of 2021 and follows improving activity in durable goods new orders data.


.jpg;width=70;height=70;mode=crop)
