Housing Permits Increase 25% in June
Unlike many other economic data series, the rate of change in June 2021 was not affected by an easy comparison with June 2020. In fact, just the opposite. June 2020 was a very strong month for housing permits. Therefore, the 25.0% growth this June is a very strong rate of growth.
There were 155,000 housing permits filed in June 2021, which was 25.0% more than the number of permits filed one year ago. Unlike many other economic data series, the rate of change in June 2021 was not affected by an easy comparison with June 2020. In fact, just the opposite. June 2020 was a very strong month for housing permits. Therefore, the 25.0% growth this June is a very strong rate of growth. Housing permits grew 12 of the last 13 months, and in 11 of those months, the growth was faster than 11.5%.
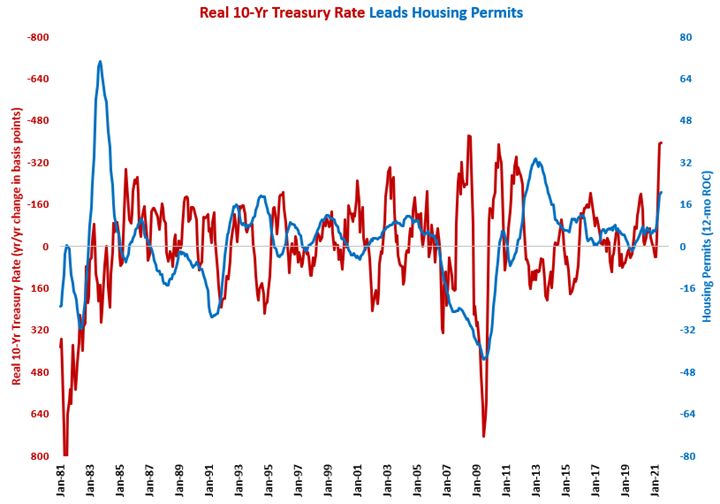
Regarding the annual rate of change, June was the 22nd straight month of growth. The annual rate of growth accelerated to 20.7%, which was its fastest rate of growth since October 2013.
While the nominal 10-year Treasury rate was down slightly, the real 10-year Treasury rate fell to its lowest rate since June 1980. The reason for this was that the rate of inflation increased to 5.39% in June, which was the highest rate of inflation since August 2008. As the real 10-year Treasury rate is the nominal rate minus the inflation rate, the real 10-year Treasury rate was -3.87% in May. Instead of pushing nominal rates into negative territory, the Fed is using higher inflation to make real rates negative. This is very stimulative to the economy.
The year-over-year change in the real 10-year Treasury, now -396 basis points, was more negative for the fourth month in a row. The change was negative for 21 of the last 23 months, falling to its lowest level since August 2008.
The change in the 10-year Treasury rate is a good leading indicator of housing permits and construction spending. A decreasing year-over-year change in the real 10-year Treasury rate typically leads to increases in housing permits.


.JPG;width=70;height=70;mode=crop)
